College is an opportunity and also an investment. With student loan payments having resumed in October 2023, students and consumers must understand the impact of monthly student loan debt payments on their buying power.
Although there’s been a slight downward trend in the most recent official data, total student debt stood at more than $1.73 trillion as of Fall 2023.1 That’s more than the totals for auto loans and revolving credit, including credit card debt. Only the mortgage market supports more debt in the US today at $12.14 trillion.2
The average federal student loan debt balance is more than $37,000 per borrower, and the total with private loans is more than $40,000.3 Student loan debt reduces consumer spending, discourages business growth and homebuying, and may result in more Americans needing the protection of the social safety net.4
Ultimately, that’s because student loan debt payments take a significant chunk of people’s monthly incomes. Here, we’ll explore some factors around monthly debt payments to better understand the implications of student loan debt.
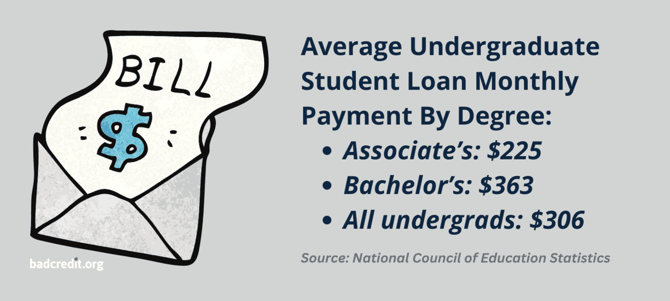
The Average Undergraduate Student Loan Debt Payment = $306/Month
Analyzing average monthly student loan debt payments is a comparative exercise. Everyone’s loans and goals are different.
Student loan payments are deferred while borrowers are in school, although some manage to make payments. Repayment typically begins six months after graduation.
Unsurprisingly, undergraduate students earning an Associate’s degree accrue smaller loans, with students earning a Bachelor’s degree spending significantly more on college.
The average student loan debt for all Associate’s and Bachelor’s degree students upon graduating is $28,150.5 The calculation for a standard repayment plan over 10 years at 5.5% interest reveals a monthly payment of $306 and an estimated total payoff amount of $36,660.
That’s more than half the average monthly car payment for a used car in the US, which is $533.6
The average debt for Associate’s degree earners is $20,740, which yields a monthly payment of $225 and an estimated total payoff of $27,010.
For Bachelor’s degree earners, the average debt is $33,440, which yields a monthly payment of $363 and an estimated total payoff of $43,549.
For perspective, consider that the median annual earnings of full-time, year-round workers with Associate’s degrees is $45,000.7 That’s $3,750 in gross monthly earnings.

Graduate and Professional Students Pay $511 to $2,559/Month
The concept of education as investment plays out even more vividly when students consider graduate or professional education. More than 866,000 students earned Master’s degrees in 2021, and more than 194,000 earned doctorates or professional degrees.
What’s most telling about the earning expectations of graduate and professional students is that when it’s time for graduate school, comparatively few students choose traditionally lower-paying degrees in liberal arts.
In 2021, of the 10.7% of undergraduate and graduate degree earners who chose liberal arts, only 0.46% earned Master’s degrees and 0.02% earned doctorates.8
Total debt load naturally increases with degree attainment and expected earning potential, with Master’s degree earners at the lower end of the scale and law and medicine graduates way above everybody else.
| Degree level | Total debt | Average monthly payment |
|---|---|---|
| Master of Education (ME) | $42,010 | $511 |
| Master of Business Administration (MBA) | $56,850 | $691 |
| Master of Science (MS) | $57,770 | $702 |
| Doctor of Education (EdD) | $62,780 | $763 |
| Master of Arts (MA) | $66,950 | $814 |
| Doctorate (PhD) | $81,900 | $996 |
| Law (LLB or JD) | $145,540 | $1,770 |
| Medicine (MD or DO) | $210,450 | $2,559 |
Female Undergraduates Pay More Than Males
Trends in higher education attendance lean toward females. The current ratio of women to men in undergraduate programs is 1.4 to 1. (That number trends higher for graduate program attendees, at 1.6 to 1.) The differences in monthly student loan payments between male and female undergraduates are relatively minor — on the surface.
The average debt for male Associate’s degree earners is $19,020, which yields a monthly payment of $206 and an estimated total payoff of $24,770. The average for females is $21,720, which produces a monthly payment of $236 and an estimated total payoff of $28,286.
The average debt for male Bachelor’s degree earners is $32,620, which yields a monthly payment of $354 and an estimated total payoff of $42,482. The average for females is $33,820, which produces a monthly payment of $367 and an estimated total payoff of $44,044.
These numbers don’t necessarily have to significantly impact monthly student loan payments for undergraduates, but they do in the real world. Median weekly earnings for full-time salaried US women are only 82% of their male counterparts. That discrepancy accentuates seemingly insignificant student loan differences.9
| Student cohort | Total debt | Average monthly payment |
|---|---|---|
| Male Associate’s degree | $19,020 | $206 |
| Female Associate’s degree | $21,720 | $236 |
| Male Bachelor’s degree | $32,620 | $354 |
| Female Bachelor’s degree | $33,820 | $367 |
African American Bachelor’s Degree Students Pay $404/Month, the Highest Among Racial & Ethnic Groups
Racial and ethnic identity is another matter entirely when it comes to student loan debt, and stark differences play out through the racial wealth gap: On average, Black and Hispanic families own about 24 cents for every $1 of white family wealth.10
The racial wealth gap results in fewer college students of color having enough resources to pay their way without student loan support. The gap also burdens graduates coming out of college with additional financial responsibilities they may not be able to handle as easily as white graduates.
For various reasons, Hispanic students tend to borrow less when they go to college. However, they may face disproportionate challenges in paying off the debt they owe.11
| Racial/ethnic group | Total debt | Average monthly payment |
|---|---|---|
| Black | $37,230 | $404 |
| White | $33,680 | $366 |
| Asian | $33,400 | $362 |
| Multiracial | $33,350 | $362 |
| Hispanic | $29,620 | $321 |
Private For-Profit Undergraduates Pay $488/Month, the Highest Among Institution Types
Ultimately, the decision to attend a particular college or university may be as much about the experience and connections made as about the academic or classroom expertise offered.
For example, some undergraduate students attend expensive private schools instead of deferring those experiences to graduate school, where they could have more direct career and professional development impact.
Attending a public four-year in-state institution is the best deal, with an average annual tuition of $9,375. Attending a nonprofit four-year private institution costs $35,852 annually — 350% higher than public college tuition.12
That’s why private school undergraduates tend to owe more student loan debt. Many private schools offer significant financial assistance funded through endowments or other means, but the cost of attending a private school results in more debt burden for undergraduates who make that choice.
| School type | Total debt | Average monthly payment |
|---|---|---|
| Public | $30,080 | $326 |
| Private nonprofit | $37,180 | $404 |
| Private for-profit | $44,920 | $488 |
Student Loan Debt Resources
Fortunately, resources to understand and plan for student loan debt and monthly payments abound. The best source of tools and resources is Federal Student Aid, the nation’s largest student financial aid provider.
Federal Student Aid offers the FAFSA® form to apply for federal student loans. FAFSA stands for Free Application for Federal Student Aid. Applying for assistance through FAFSA is a yearly ritual for most US college students, regardless of financial status.
We used Federal Student Aid’s FAFSA® loan simulator to compute monthly loan payments in this research, and you can, too. The simulator considers various loan and payment scenarios to help users understand what they’re getting into in financing college through financial aid and how to manage loan payments when they graduate.
Federal Student Aid offers various income-driven repayment plans to assist financially challenged students with monthly payments. Plans include SAVE, which was introduced in 2022 to limit monthly payment amounts to 10% of discretionary income.
Loan forgiveness, cancellation, and discharge options are also available. Students may qualify for forgiveness in many ways, including occupation, disability status, and income. Federal Student Aid offers many tools to help students and graduates understand their options and obtain the support they qualify for.
Methodology
We used student loan data from the National Center for Education Statistics, the U.S. Department of Education research institute responsible for collecting, analyzing, and publishing statistics on education and public school district finance information.
Using the FAFSA loan simulator at Federal Student Aid described above, we calculated monthly loan payments by assuming the student was on the standard repayment plan and paying over 10 years at the average interest rate of 5.5% for direct subsidized loans for undergraduates and 8.05% for graduate and professional students. We assumed the students’ goals were to pay the lowest total amount over time.
More Student Loan Debt Statistics
Average Student Loan Debt by Age
Average Student Loan Debt by Degree
Average Student Loan Debt by Year
Average Student Loan Debt by State
Average Student Loan Debt by Generation
Average Student Loan Debt by Race
Data Sources
1 https://fred.stlouisfed.org/series/SLOAS
2 https://www.newyorkfed.org/newsevents/news/research/2023/20231107
3 https://educationdata.org/student-loan-debt-statistics
4 https://educationdata.org/student-loan-debt-economic-impact
5 https://nces.ed.gov/programs/digest/d22/tables/dt22_331.95.asp
6 https://www.bankrate.com/loans/auto-loans/average-monthly-car-payment/
7 https://nces.ed.gov/programs/coe/indicator/cba/annual-earnings
8 https://educationdata.org/number-of-college-graduates
9 https://www.bls.gov/opub/reports/womens-earnings/2020/home.htm
10 https://www.stlouisfed.org/institute-for-economic-equity/the-state-of-us-wealth-inequality
11 https://www.cnbc.com/2023/10/02/latino-student-loan-borrowers-face-extra-challenges-as-bills-restart.html
12 https://educationdata.org/private-vs-public-college-tuition


