

Writer: Erica Sandberg


Editor: Jon McDonald


Reviewer: Ashley Fricker

The difference between the money Americans earn and the wealth they accumulate varies wildly. Why? A huge number of reasons, including several within our control.
For example, you might start out making very little, but as you gain skills and experience, your salary may grow substantially. How you manage your money, from spending to investing, is another key factor.
Still, other factors aren’t quite so straightforward or malleable. Economic conditions and political policies, where you live, inherent advantages and disadvantages, education, family assistance, and natural drive and abilities are also considerations.
What’s going on, and how do you compare to the rest of the country? Here are 29 recent statistics about income inequality that show where U.S. workers stand today.
1. The Lowest 20% of Households Increased Income 1.5%, Compared With 2.1% Overall
Is there a built-in economic slowdown for low-income earners? It would seem so. After adjusting for inflation, the average household income for the poorest 20% rose just 1.5% in 2025, while income across the overall distribution grew 2.1%.1
| Income Group | Inflation-Adjusted Growth % |
|---|---|
| Poorest 20% | 1.5% |
| Middle 60% | 2.7% |
| Richest 20% | 2.0% |
| Overall Average | 2.1% |
But this is a specific snapshot of time, and growth rates vary. Therefore, while it can seem like the odds are stacked against people earning the least, it’s important to remember that individual circumstances can change, and income growth can vary considerably from year to year.
2. The Four-Person Family Poverty Threshold Is Now $33,000.
Bring in no more than $2,750 a month? If there are three others in your household, you fit within the federal poverty level (FPL) threshold.2
As a single person, the FPL is just $15,960, and that number increases by about $5,680 for each additional person you have in your household. Even with helpful government programs, it can be extremely challenging to make ends meet.
3. There Is More Than a 1,400,000% Wealth Gap Between the Average Billionaire and the Average American.
There is definitely a lot of talk about billionaires lately. One reason is that there is such an enormous differential between their wealth and that of the typical person in the United States.
The gap, as of this writing, stands at an almost incomprehensible 1,467,604%.3
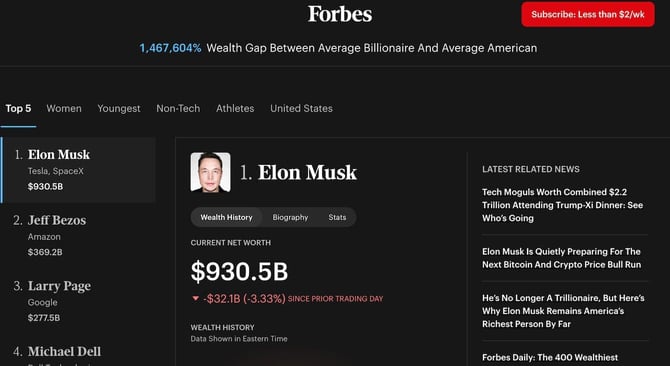
However, it’s important to remember that these figures represent the total value of their assets, which is typically in corporate stock, private businesses, or investments, not cash sitting in a bank.
4. The Combined Wealth of the Top 10 Billionaires is Around $3 Trillion
The top ten richest people in the world have a combined wealth of around $3 Trillion as of the time this article was published.3 For some perspective on that number, it’s nearly half of the total federal government’s budget of $7.04 trillion.4
In a practical sense, what does their wealth mean to you? On the positive side, it can result in job creation, consumer spending, innovation, and philanthropy.
On the negative side, extremely high-net-worth individuals can drive real estate prices up, exacerbating housing unaffordability.
5. 40% of Low-Income Households Pay No Federal Income Tax
A substantial portion of American workers end up not paying any federal income tax at all. Of them, about 70% earn less than $75,000, and 45% earn less than $40,000.5
It’s not because these workers are evading Uncle Sam, but because the standard deduction and refundable credits, such as the Earned Income Tax Credit and the Child Tax Credit, can negate the amount they might owe.
6. The Top 10% of Income Earners Pay More Than 60% of All Taxes
All those multimillionaires and billionaires contribute a tremendous amount of money to the government coffers. They give well over half of all the taxes that are collected.6
| The Top 10 Billionaires in the U.S. | ||
|---|---|---|
| Rank | Name | Net Worth |
| 1 | Elon Musk | $839 Billion |
| 2 | Larry Page | $257 Billion |
| 3 | Sergey Brin | $237 Billion |
| 4 | Jeff Bezos | $224 Billion |
| 5 | Mark Zuckerberg | $222 Billion |
| 6 | Larry Ellison | $190 Billion |
| 7 | Bernard Arnault | $171 Billion |
| 8 | Jensen Huang | $154 Billion |
| 9 | Warren Buffett | $149 Billion |
| 10 | Amancio Ortega | $148 Billion |
With their money, the country can do what it needs to do, from funding essential public programs to ensuring national defense, keeping social safety nets intact, and, of course, paying government workers.
7. 61% of Americans Report Being “Bothered” by Feeling That the Wealthy Don’t Pay Their Fair Share
Are the extremely flush folks paying enough in taxes? If you think they should pay more than what they’re currently coughing up, you are in the majority.7
It can definitely be agitating to be stuck in the middle, where your tax obligation is a huge financial burden, but people who make a large amount of money won’t feel the same pain even when they are contributing a large sum.
8. 60% of Americans Say They Pay “More Than Their Fair Share” in Taxes
This statistic further demonstrates the frustration of workers caught in the income middle.
People who fall under the poverty line not only don't pay taxes but can also receive federal services.
Big earners do pay a lot in taxes, but can still afford all kinds of things they want to buy.
But if you're in between those groups, you may wonder just what you're getting for your tax dollar.7
9. About 1 in 5 Low-Income Workers Consistently Save Money at the End of Each Month
The more you earn, the easier it might be to set cash aside. However, this is not always the case. Plenty of people who earn a tremendous amount of money spend what they bring in and then some.
That nearly 20% of low-income workers consistently save money shows that, in many cases, it can be done.8 The easiest way is to have cash deducted from your paycheck and sent to a separate savings account.
10. 69% of Nonretirees Are Worried They Won’t Have Enough Money to Retire Comfortably
When your wages are low, and you don't see a path forward to a higher salary, you may worry about retirement, as nearly 7 in 10 American nonretirees already do.9 The wealthy, though, can just stop working. Reduce anxiety by contributing to a 401(k).
If you start at age 32 with a $50,000 salary, contributing 10% of your pay plus a typical 3% employer match, with 3% annual salary growth and 7% average returns, you’ll have roughly $1.1 million by the time you turn 65.
11. 82% of Lower-Income Americans Find Basic Necessities Like Groceries Unaffordable
The financial stress Americans with low incomes experience when trying to pay for essentials such as groceries is all too real. Yet more than half of households that have incomes exceeding $100,000 are feeling the pinch at the supermarket as well.10
| Income Group | Percent Who Think Basic Necessities are Unaffordable |
|---|---|
| Under $50K | 82% |
| $50K-$100K | 70% |
| Over $100K | 56% |
| Overall | 65% |
One reason is that the price of groceries increased more than 2.7% in the 12 months ending in July 2026, with some staples (such as coffee and beef) rising even more dramatically.11
12. The Portion of the Country Identifying Their Current Financial Situation as "Poor" Hit 19%
This statistic shows that less than half of Americans say their financial situation is “excellent” or “good,” and more than a third call it “only fair.” But 19% say their financial situation is “poor.”12
Affordability concerns dominated the responses, with combined mentions of inflation, energy, housing, and healthcare costs, college expenses, transportation costs, and childcare exceeding all other types of financial concerns.
13. About 8 in 10 Households With Under $50,000 in Income Live Paycheck-to-Paycheck
It would make sense that people living on the low end of the income spectrum use every dollar of their paycheck and wait nervously until the next one comes in, but a fair number of very high-income earners also do the same.13
| Income Group | Percentage Living Paycheck-to-Paycheck |
|---|---|
| Under $50K | 81% |
| $50K-$99,999 | 64% |
| $100K-$249,999 | 41% |
| $250K and Above | 12% |
| Overall | 63% |
In fact, 64% of people earning $50,000 to $99,999 and 41% of people earning $100,000 to $249,999 also do. That shows paycheck-to-paycheck living is all too common.
14. Women Collectively Earn 18% Less Than Men Across the Macroeconomy.²⁷
There are a number of reasons men tend to earn more than women as a whole, including occupational segregation.
Women and men are not evenly represented across all industries and occupations, and women may be statistically less likely to hold some of the highest-paying senior leadership positions.
Such differences can add up over the course of a person's career, creating a deep income gap even when individual workers have similar skills and experience.14
15. Employed Mothers Earn Just $0.74 for Every $1 Earned by Working Fathers
Job choice can play a role in this disparity.15 Mothers may choose jobs that offer greater flexibility, predictable schedules, or better benefits than fathers or men who don’t have young children at home.
Unfortunately, though, these types of jobs don’t always pay as much as those that demand long hours, frequent travel, or require less flexibility. The end result can be less money for employed mothers.
16. Black Women Are Paid Only 68.3% of the Median Wages Earned by White Men
This disparity also reflects a combination of factors, including occupational segregation. There might also be differences in access to higher-paying jobs and educational and economic opportunity gaps.16
Family wealth can be an issue. Although this may be a difficult problem to solve overall, on an individual level, pursuing higher education, taking advantage of career advancement programs, and networking can narrow (if not eliminate) the difference.
17. A 32% College Participation Gap Exists Between the Highest and Lowest Economic Segments of Young Adults
Family income can make a difference when it comes to college. Students from lower-income households can struggle to pay for tuition, housing, books, and transportation.17
They may also have fewer opportunities to attend well-resourced schools, get SAT tutoring, or receive help with college applications. In the end, when fewer people from lower-income families attend college, income disparities can continue into the next generation.
18. Younger High-Net-Worth Investors Receive an Average of 20% of Their Assets Through Inheritance
Millennials and Generation X are expected to inherit nearly $18 trillion over the next decade.18
This transfer of wealth could provide a tremendous financial boost to the people who receive it, helping them buy homes, start businesses, invest, or simply build a larger financial cushion.
Yet it also shows how income and wealth inequality can pass from one generation to the next.
19. 25% of Gen Z/Millennials Say They Want Wealth to Create Opportunities for Others
Here’s an optimistic message for the future! For many young Americans, building wealth isn't necessarily a selfish endeavor.
Sure, loads of money can help buy more things, live luxuriously, and remain financially comfortable, but it seems that plenty of Gen Z and millennials are also altruistic.19
They want to help create jobs, invest in businesses, and support their communities so people who have less can rise out of their less advantaged circumstances.
20. 47% Are Using Personal or Family Resources to Start a Business
Although this sounds like a lot, the figure is actually down from 66% in 2022.19 Still, having any kind of access to personal or family money can give an aspiring entrepreneur an advantage.
| Year | Percent Who Used Personal or Family Resources to Start a Business |
|---|---|
| 2022 | 66% |
| 2024 | 62% |
| 2026 | 47% |
You may be able to launch a business with less debt, survive a period without profits, or invest more heavily in marketing and equipment.
People without such financial safety nets may have amazing business ideas. but don't have the means to take the same risks.
21. 52% of Americans Say the Gap Between Rich and Poor Is a Very Big Problem
People are clearly concerned about income inequality and how it affects their everyday lives. When wages don't keep up with the cost of living, it can feel as though the people at the very top are getting further ahead while everyday Americans are struggling to keep up and survive.
Even people who are doing reasonably well may worry about whether their children will have the same opportunities they had.20
22. 59% of Americans Say the Federal Government Should Try to Reduce Wealth Inequality
Many people feel frustrated with the gap between wealthy and less-wealthy Americans and are seeking solutions from politicians.20
There are a number of ways that might happen, including income tax changes, more effective government benefits, universal healthcare, and increased funding for education, all designed to enhance economic opportunity.
23. 51% of U.S. Adults Believe the American Dream Is Currently Unachievable for Most People
There is a big problem when just over half of Americans don't have confidence in the American Dream.21
Traditionally, that dream means being able to own a home, enjoy a better quality of life than their parents, and eventually achieve financial stability.
When people believe such milestones are out of reach, they may lose motivation to pursue them at all, or become so discouraged that they lose faith in the economic system entirely.
24. 81% of Those Surveyed Said the Wealthy and Non-Wealthy Are More Divided Than United
Resentment is building in the country, with a growing sense of division between wealthy and non-wealthy Americans.22
It can be frustrating to compare your financial situation with someone who appears to have far more opportunities and resources, but you can still control many aspects of your own financial health.
Concentrating on earning more, reducing unnecessary expenses, building savings, and investing when possible can help you make progress regardless of what other people have.
25. 86% Say Wealthy Americans Avoid Legal and Social Consequences That Ordinary People Face
Wealthy people have access to expensive attorneys, accountants, public relations professionals, and other forms of representation that ordinary people may not be able to afford. That can create doubt about equal treatment.22
Still, we all have to follow the same laws, and having financial resources does not automatically mean someone is exempt from legal or social consequences.
26. 53% of Americans View Billionaires as a Direct Threat to U.S. Democracy
When wealth gets extremely large, such as when someone becomes a billionaire, people can begin to think that the disparity is problematic for the entire country.23
The concern isn't necessarily that having so much money is immoral (though some do believe this).
Instead, the concern is that enormous fortunes can result in a small group having too much economic or political power.
27. 51% of Americans Feel Capitalism Is Not Delivering the Lifestyle Stability They Expected
More than half of Americans are questioning whether capitalism makes sense.24 If you’re working hard and still struggling to afford a home, save for retirement, or handle unexpected expenses, it can be difficult to trust that the system is delivering the financial stability you want.
Still, plenty of people of meager means have created financial stability and wealth through the system of capitalism.
28. 67% of Voters Prefer Giving Financial Aid Only to Those Who Can’t Support Themselves
Most American voters believe that financial aid should only go to those who truly cannot support themselves.
Only about a quarter say universal benefits should be given to everyone regardless of need.25
That suggests many Americans see the social safety net as something that should be targeted toward people facing genuine hardship rather than automatically provided to everyone.
29. 65% of Americans Believe the Safety Net Should Guarantee a Decent Standard of Living
Most Americans also said the main purpose of a safety net should be to ensure everyone has a basic, decent standard of living.25
Just 21% believe its primary goal should be to reduce the gap between rich and poor. So people appear more interested in making sure no one falls below a certain financial floor than in making everyone's income more equal.
Where We Go From Here on Income Inequality
Each of these statistics is fascinating on its own, but taken together, they construct an image of where the country is today. Americans seem to be in flux, questioning everything from the political and economic systems to just how (and if) income inequality ought to be addressed.
The majority of people in the U.S. are feeling financial pressure. There are strong indications that people do want more opportunities and less disparity, and are afraid that an overabundance of wealth is concentrated at the top.
Data Sources:
1 https://equitablegrowth.org/press/equitable-growth-responds-to-u-s-bureau-of-economic-analysis-2025-personal-income-data-release/
2 https://usafacts.org/explainers/what-is-the-federal-poverty-level/country/united-states/
3 https://www.forbes.com/real-time-billionaires/
4 https://usafacts.org/answers/how-much-does-the-us-federal-government-spend/country/united-states/
5 https://taxpolicycenter.org/fiscal-facts/who-will-pay-no-federal-individual-income-tax-2025
6 https://www.cato.org/blog/tax-day-five-charts-who-pays-how-much
7 https://www.pewresearch.org/
8 https://www.federalreserve.gov/publications/2026-economic-well-being-of-us-households-in-2025-housing.htm
9 https://news.gallup.com/poll/709319/nonretirees-worry-remains-high.aspx
10 https://www.ipsos.com/en-us/Washington-Post-Ipsos-Poll-July-2026
11 https://www.bls.gov/news.release/cpi.htm
12 https://news.gallup.com/poll/708905/affordability-dominates-americans-financial-worries.aspx
13 https://www.surveymonkey.com/curiosity/cnbc-money-survey-affordability-july-2026/
14 https://www.payscale.com/featured-content/gender-pay-gap
15 https://www.bls.gov/opub/ted/2026/median-weekly-earnings-1098-for-women-1362-for-men-first-quarter-2026.htm
16 https://stateline.org/2026/03/19/the-pay-gap-between-women-and-men-widened-last-year-analysis-finds/
17 https://www.pellinstitute.org/wp-content/uploads/2026/05/Full-Report_Pell-Institute-2026-Indicators.pdf
18 https://www.gallup.com/analytics/701519/worlds-most-important-problem-report.aspx?
19 https://www.privatebank.bankofamerica.com/articles/study-of-wealthy-americans.html
20 https://yougov.com/en-us/articles/53821-majorities-americans-say-wealth-inequality-is-problem-want-government-intervention-january-2-5-2026-economist-yougov-poll20
21 https://www.cnbc.com/2026/06/09/american-dream-out-of-reach-most-people-right-now-cnbc-survey.html
22 https://www.nbcnews.com/politics/politics-news/different-worlds-americans-see-huge-divide-haves-nots-new-poll-shows-rcna350523
23 https://www.forbes.com/sites/maryroeloffs/2025/11/14/americans-want-billionaires-out-of-politics-and-think-theyre-a-threat-to-democracy-poll-shows/
24 https://www.wsj.com/politics/policy/wsj-poll-usa250-capitalism-democracy-940af905
25 https://manhattan.institute/article/american-attitudes-on-welfare-waste-crime-and-the-political-environment


