
Already approaching 7.5 billion halfway through 2017, the world population is projected to top the 8 billion mark around 2023. In the US alone, a new American is born about every eight seconds, constantly adding to a population well above 325 million.
Yet, despite being surrounded by literally millions of other people, it can be remarkably easy to feel completely alone, especially when dealing with a difficult situation. For instance, almost 80% of Americans have a credit card, more than half of whom carry a balance on their cards. But for those struggling with a balance that’s gotten out of control, it can feel like you’re the only one.
Total US Debt | Average Household Debt | Statistical Breakdown
Total US Credit Card Debt Pushes Closer to $1 Trillion Mark
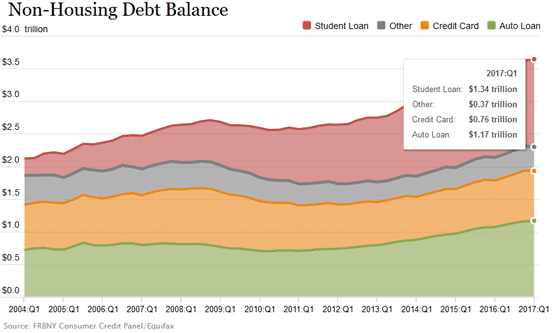
Well, according to the data, no one is alone — not so far as credit card debt is concerned, at least. The latest statistics released from the Center for Microeconomic Data for the Federal Reserve Bank of New York show that total US credit card debt hit $764 billion in the first quarter of 2017.
While this is $15 billion less than Q4 of 2016, it represents around a 7% increase year over year, and a 13% increase from the post-recession low of $660 billion. That said, the overall numbers are still a far cry from the $870 billion total credit card debt hit during the Great Recession.

Data from the Federal Reserve Bank of New York shows total credit card debt at $764 billion.
However, despite the overall increase in credit card debt over the last several years, delinquency rates remain near their lowest levels in decades with credit card delinquency at 2.42%. Credit card charge-offs also remain at historically low levels, coming in at 3.6% for Q1 of 2017.
Furthermore, credit card debt represents less than 21% of Americans’ total non-housing debt. In fact, the bulk of the sharp rise in the non-housing debt balance over the last decade can be attributed to the drastic increase in student loan debt, which rose from $510 billion in Q1 of 2007 to $1.34 trillion in Q1 of 2017.
And non-housing debt pales in comparison to what Americans owe on their mortgages. In the first quarter of 2017, housing debt topped $9 trillion for the first time in a decade, reaching pre-recession heights not seen since 2007. Overall, household debt stood at a whopping $12.73 trillion as of March 31, 2017.
Average Household Credit Card Debt Reaches $6,000
While the national numbers give an indication of the general state of financial affairs in the country as a whole, they likely need more context to be useful to the typical consumer. In particular, these statistics can be much more useful when analyzed in terms of the debt held by the average household, rather than the country as a whole.
Along that vein, the US had approximately 126 million households at the beginning of 2017. Diving into the total credit card debt of $764 billion, it turns out that the average American household carried approximately $6,063 in credit card debt through the first quarter of 2017.
Another way to analyze the credit card debt statistics is to look at how the numbers stack up for those who are actually carrying all that debt. Of the 126 million US households, about 38% — or 48 million — of households maintain a credit card balance from month to month.

FRED data shows the US had approximately 126 million households at the start of 2017.
Doing the math, that means each household with credit card debt has an average balance of $15,917. With most card-carrying consumers averaging 2.6 credit cards apiece, the typical individual credit card balance — among those who carry a balance — is around $6,122 per card.
Additionally, considering the average credit card APR of 16.6%, households with the typical $15,917 in credit card debt will see a nominal cost of $2,642 a year in interest fees. For those stuck paying a higher subprime rate — or, worse, the 29.99% often charged as a penalty rate — that number could skyrocket to over $4,750 a year in interest fees.
Breaking Down the Credit Card Debt Statistics
Although perhaps shocking to those who haven’t before heard their like, the average credit card debt for US households in the first quarter of 2017 has varied only slightly over the previous few quarters. And, beyond being a way to see how your own debt falls on the credit card spectrum, few of those statistics are terribly enlightening.
Indeed, it’s often not until you break down those statistics that the truly interesting data comes to light. For instance, while women are often stereotyped as spending more money, a ValuePenguin report found it’s actually men who carry the most credit card debt — 22% more. Other trends in the data suggest things like income, age, and region can play a role in average credit card debt, as well.
Debt By Income
When considering the distribution of credit card debt among US households, one of the first assumptions people likely make is that those with the highest incomes carry little to no credit card debt — and they’d be wrong. Although those carrying the bulk of the credit card debt are the poorest consumers, with negative or zero net worth, those with the most money aren’t as far behind as you may think.
In fact, according to the ValuePenguin report, households with a net worth of $500,000 and up have an average credit card debt of $8,139, just $2,168 less than the most indebted group. When looking at individuals, average card debt actually increases with income, and a separate NerdWallet study found that households with the most income also tend to pay the most credit card interest, averaging $2,515 a year.
Debt By Age
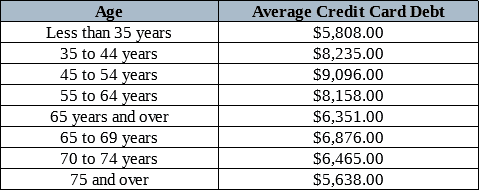
In addition to income, it turns out that age may also be a factor influencing how much credit card debt we carry. The same ValuePenguin study discovered that consumers aged 35 to 64 carry an average of 27% more credit card debt than those older or younger, whether due to that period being the prime earning years for many, or simply the period in which many undergo the expensive process of raising children.

According to data from ValuePengiun, average credit card debt increases with income.
By the numbers, those ages 35 to 44 tend to have $8,235 in credit card debt and consumers aged 45 to 54 toting around an average balance of $9,096 on their cards. In contrast, cardholders under 35 have an average of $5,808, and the oldest consumers, aged 75 and older, have the lowest average balance at $5,638.
Debt By Region
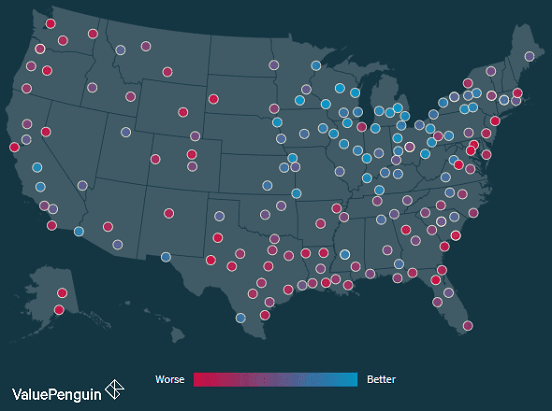
Another interesting breakdown of the credit card statistics comes when they’re analyzed by region, as it turns out that location may have some impact on your debt levels. In particular, both the ValuePenguin report and analysis by Bankrate found that residents of Alaska held the largest credit card debts, while the people of Iowa held the least amount of credit card debt, with average debts of $7,706 and $4,734, respectively.

This map shows the average credit card debt for various regions across the country.
In general, areas with the highest cost of living tended to have the highest debt, with New York, Connecticut, Virginia, and Colorado all topping the list. States typically considered to be mainly rural, including North and South Dakota, Maine, and Nebraska, all fell at the bottom of the list. Surprising to some, a few states associated with high-cost-of-living cities, such as California and Massachusetts, actually fell in the middle of the pack.
While Rising, Household Debt Still Below Recession Levels
Despite being surrounded by literally billions of people, it’s still easy to feel alone in some of our most trying situations, including the battle with credit card debt. As the statistics clearly show, however, no one is facing it alone. Millions of Americans carry credit card debt, regardless of wealth, income, age, or even region.
But they won’t always be. Whether on their own or with help, perhaps from an experienced debt relief program, Americans are making their way out of debt.
Top-Rated Debt Relief Companies
Furthermore, while year-over-year credit card debt has increased 7% as population and spending rises, levels still remain well below — more than $100 billion below — the heights reached during the financial crisis of the 2000s.
Advertiser Disclosure
BadCredit.org is a free online resource that offers valuable content and comparison services to users. To keep this resource 100% free for users, we receive advertising compensation from the financial products listed on this page. Along with key review factors, this compensation may impact how and where products appear on the page (including, for example, the order in which they appear). BadCredit.org does not include listings for all financial products.
Our Editorial Review Policy
Our site is committed to publishing independent, accurate content guided by strict editorial guidelines. Before articles and reviews are published on our site, they undergo a thorough review process performed by a team of independent editors and subject-matter experts to ensure the content’s accuracy, timeliness, and impartiality. Our editorial team is separate and independent of our site’s advertisers, and the opinions they express on our site are their own. To read more about our team members and their editorial backgrounds, please visit our site’s About page.


