



States with the Most Intense Sports Betting Activity


Writer: Lynn Cadet


Editor: Ashley Fricker


Reviewer: Adam West

Key Takeaways
- New Jersey leads the nation in intense sports betting activity, reflecting its long-established, highly active gambling market.
- The top states scored highly in metrics related to betting access and engagement, as well as per capita financial activity.
- Maine ranks last in sports betting activity due to low engagement and a smaller market, as evidenced by its low search volume and limited access to gambling apps.
America is currently experiencing a sports betting boom. From 2020 to 2025, the money wagered by Americans on sports bets grew from roughly $20 billion to $165 billion, outpacing traditional gambling channels like casinos and the lottery in growth.
But while the increased activity may benefit the betting industry, it’s also amplifying potential financial risks for consumers, including minors.
And depending on where you live, the level of intensity of sports betting can vary, as can the financial risks involved. While sports betting is legal in 39 states, this analysis includes only states with sufficiently developed markets and consistent public reporting across key metrics, resulting in a subset of 25 states.
Nevada has a gambling history dating back to the 1930s and remains the country’s most iconic sportsbook hub. Its tourism-driven market makes it an outlier, so it was excluded to keep comparisons meaningful. The remaining rankings reveal where sports betting is quietly becoming a financial pressure point for everyday residents.
To determine the states with the highest sports betting activity, we examined state-level differences in handle per capita, revenue per capita, credit card delinquency rates, search-based engagement signals, and market access across applicable U.S. states.
Based on a weighted 100-point scoring system, here are the states where sports betting is the most prevalent and potentially risky.

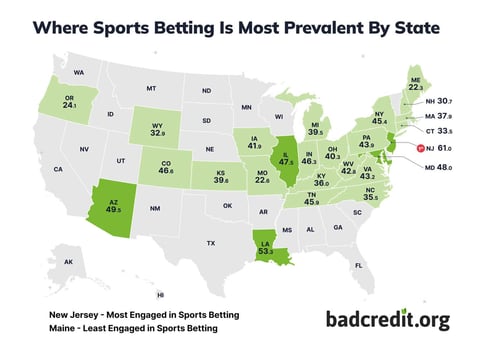
“As a form of entertainment, betting on sports can be totally fine. After all, you may spend $15 on a movie or use that same sum to gamble that a specific team will win a game,” says Erica Sandberg, personal finance expert at BadCredit.org. “Since it’s done online, you can track the adjusting odds.”
“However, bettors need to be super conscious of it transitioning from affordable fun into an expensive compulsion. If you lose, you may try to win back the money with more cash, which you may also lose. And winning can be an intoxicating feeling, which can prompt you to play again and with bigger sums.”
Main Findings
The table below ranks each state across four key metrics: betting behavior, financial harm, demand and distress, and market access.
| Rank | State | Total Score | Betting Behavior | Financial Harm | Demand & Distress | Sports Betting Access | Total Handle / Total Pop. | Total Revenue / Total Pop. | State CC Delinquency Rate | Avg Search “Sports Betting” | Avg Search “betting apps” | Avg Search “gambling addiction” | Avg Search “gambling help” | Total Betting Apps | Legal Betting Online | Years Legal |
|---|---|---|---|---|---|---|---|---|---|---|---|---|---|---|---|---|
| 1 | New Jersey | 61.0 | 52.01 | 34 | 57.09 | 95.67 | 7768.76 | 623.93 | 5.14% | 56 | 68 | 71 | 62 | 12 | 1 | 7.9 |
| 2 | Louisiana | 53.3 | 26.12 | 78.61 | 75.82 | 73.5 | 3014.10 | 370.70 | 7.58% | 63 | 90 | 68 | 100 | 8 | 1 | 4.2 |
| 3 | Arizona | 49.5 | 29.82 | 50.09 | 42.38 | 88.87 | 4261.04 | 372.39 | 6.02% | 47 | 53 | 64 | 43 | 12 | 1 | 4.6 |
| 4 | Maryland | 48.0 | 25.82 | 48.81 | 61.61 | 79.12 | 3115.19 | 358.27 | 5.95% | 65 | 73 | 64 | 68 | 10 | 1 | 3.4 |
| 5 | Illinois | 47.5 | 33.51 | 33.46 | 47.53 | 81.05 | 4833.00 | 414.93 | 5.11% | 50 | 50 | 64 | 62 | 9 | 1 | 6.1 |
| 6 | Colorado | 46.6 | 31.94 | 26.14 | 42.15 | 87.91 | 4966.14 | 374.08 | 4.71% | 47 | 47 | 57 | 56 | 11 | 1 | 5.9 |
| 7 | Indiana | 46.3 | 27.88 | 42.78 | 39.15 | 85.72 | 3901.39 | 353.74 | 5.62% | 38 | 50 | 60 | 50 | 10 | 1 | 6.6 |
| 8 | Tennessee | 45.9 | 24.41 | 48.08 | 52.03 | 79.61 | 3293.35 | 317.99 | 5.91% | 43 | 61 | 64 | 75 | 9 | 1 | 5.4 |
| 9 | New York | 45.4 | 32.3 | 39.31 | 44.26 | 73.5 | 4500.26 | 409.85 | 5.43% | 54 | 47 | 62 | 50 | 8 | 1 | 4.2 |
| 10 | Pennsylvania | 43.9 | 24.37 | 38.76 | 47.04 | 80.09 | 3474.25 | 306.19 | 5.40% | 39 | 45 | 77 | 68 | 8 | 1 | 7.4 |
| 11 | Virginia | 43.2 | 25.46 | 31.63 | 36.16 | 86.47 | 3334.15 | 337.49 | 5.01% | 40 | 44 | 53 | 50 | 11 | 1 | 5.2 |
| 12 | West Virginia | 42.8 | 13.81 | 64.17 | 51.25 | 76.87 | 1888.53 | 181.51 | 6.79% | 51 | 50 | 71 | 68 | 7 | 1 | 7.6 |
| 13 | Iowa | 41.9 | 28.31 | 13.89 | 37.49 | 85.72 | 4283.76 | 339.51 | 4.04% | 45 | 47 | 55 | 43 | 10 | 1 | 6.6 |
| 14 | Ohio | 40.3 | 18.47 | 41.86 | 39.88 | 78.91 | 2336.27 | 251.76 | 5.57% | 44 | 50 | 62 | 43 | 10 | 1 | 3.3 |
| 15 | Kansas | 39.6 | 21.39 | 26.14 | 59.13 | 68.62 | 2936.72 | 276.45 | 4.71% | 58 | 65 | 80 | 62 | 7 | 1 | 3.6 |
| 16 | Michigan | 39.5 | 18.65 | 33.27 | 45.11 | 77.41 | 2547.25 | 242.72 | 5.10% | 38 | 43 | 66 | 75 | 8 | 1 | 6.1 |
| 17 | Massachusetts | 37.9 | 23.67 | 22.85 | 46.38 | 67.59 | 3172.83 | 309.80 | 4.53% | 47 | 43 | 66 | 68 | 7 | 1 | 3.1 |
| 18 | Kentucky | 36.0 | 12.02 | 48.63 | 45.66 | 65.94 | 1502.58 | 167.28 | 5.94% | 39 | 60 | 53 | 68 | 7 | 1 | 2.3 |
| 19 | North Carolina | 35.5 | 9.91 | 61.97 | 35.41 | 65.53 | 1294.68 | 135.75 | 6.67% | 36 | 41 | 53 | 56 | 7 | 1 | 2.1 |
| 20 | Connecticut | 33.5 | 18.56 | 34 | 40.16 | 55.93 | 2375.21 | 251.25 | 5.14% | 37 | 41 | 64 | 62 | 3 | 1 | 4.5 |
| 21 | Wyoming | 32.9 | 11.3 | 13.71 | 66.14 | 63.41 | 1447.61 | 155.68 | 4.03% | 100 | 72 | 100 | 6 | 5 | 1 | 4.6 |
| 22 | New Hampshire | 30.7 | 23.45 | 15.9 | 31.12 | 52.37 | 3258.80 | 299.91 | 4.15% | 37 | 30 | 62 | 43 | 1 | 1 | 6.3 |
| 23 | Oregon | 24.1 | 6.77 | 18.46 | 33.44 | 52.99 | 872.86 | 95.73 | 4.29% | 28 | 28 | 66 | 62 | 1 | 1 | 6.6 |
| 24 | Missouri | 22.6 | 1.31 | 36.38 | 74.25 | 21.82 | 149.55 | 25.45 | 5.27% | 88 | 100 | 55 | 62 | 7 | 0 | 0.3 |
| 25 | Maine | 22.3 | 7.24 | 12.61 | 34.51 | 47.97 | 940.33 | 101.39 | 3.97% | 47 | 37 | 53 | 43 | 2 | 1 | 2.4 |
Editorial Note: Nevada was excluded from this analysis due to its long-established dominance in the sports betting market. As the only state where sports betting was legal for decades prior to the 2018 Supreme Court ruling, its data would skew results and obscure meaningful trends among newly legalized markets.
A Closer Look at the Top 5 States
States with the highest sports betting activity showed a strong performance across engagement, access, and demand. Other states in the top five also rank highly due to elevated financial stress among residents and strong gambling demand despite lower overall betting numbers.
1. New Jersey
New Jersey comes in first place, standing out for its extensive betting access. Residents of New Jersey have had access to 12 betting apps for about 8 years now, solidifying its maturity. It builds on this with high gambling activity, exhibited through its $7,848.35 in handle per capita and $630.32 in revenue per capita a year.
Like Nevada, New Jersey is home to another major casino city in the United States, Atlantic City, which already suggests strong engagement. Search engine interest includes frequent search signals for “betting apps” (68) and “sports betting” (56) for the state.
2. Louisiana
Louisiana ranks second for sports betting activity with a score of 52.9 out of 100. Unlike the previous rankings, Louisiana ranks highly primarily due to the financial stress, risk factors, and demand surrounding sports betting in the region.
The state has the highest credit card delinquency rate among the top states, sitting at 7.58%. Despite the elevated financial risks, interest is still strong among residents, with recurring search signals for “gambling help” (90) and “betting apps” (100) suggesting strong demand.
While Louisiana has moderate betting volume compared to other top states, it’s clear that sports betting is still prevalent within the state, based on its high level of search demand and access (8 betting apps), despite notable risk factors.
3. Arizona
With a 49.5 out of 100, Arizona takes third place for sports betting intensity. Arizona proves it’s a growing market for sports bettors by releasing 12 online betting apps in just under 5 years, showing its dedication to the industry.
The state earns $383.12 in revenue per capita and pulls in $4,383.76 in handle per capita annually, emphasizing its growing draw in sports betting. Interest isn’t weak among residents either, with searches for “gambling help” (43) and “sports betting” (47) prevalent.
While activity here isn’t as strong as in Nevada or New Jersey, Arizona’s high market access, combined with its 6.02% credit card delinquency rate, establishes it as a highly active and risky environment for sports betting.
4. Maryland
Maryland comes in fourth place, with strong betting access and demand. While a smaller state with a rich history, Maryland has one of the highest numbers of professional sports teams with large fan bases in the top five, besides Louisiana and Arizona.
Search engine queries for “betting apps” and “sports betting” are prominent among residents and visitors. To meet its growing interest, Maryland released 10 betting apps over the last 3 years, increasing access for bettors.
Maryland’s actual betting activity is more moderate than some on the list, with $3,137.59 in handle per capita and $360.85 in revenue per capita, but it remains a highly active sports betting state.
5. Illinois
Illinois closes out the top five with a score of 47.49, backed by nearly six years of legal sports betting and a well-developed market. Home to five major professional sports teams, Illinois has no shortage of fan engagement to fuel betting activity.
The numbers reflect it with $4,833 in handle per capita and $414.93 in revenue per capita, figures that actually outpace several higher-ranked states.
With 9 betting apps available and steady search interest for “betting apps” (50) and “sports betting” (50) among residents, Illinois has built the infrastructure to match its demand, reinforcing its place as one of the more active betting environments in the country.
A Closer Look at the Bottom 3 States
Of states where sports betting is legal, each state in the bottom rankings had this in common: low sports betting activity, limited access to betting apps, and a lower rate of seeking third-party resources or support related to sports betting or gambling. In this case, maybe finishing last isn’t necessarily a bad thing.
25. Maine
Maine ranks as the least intense state for sports betting activity, primarily due to its low engagement and small market size. The state only offers two online betting apps and shows low search interest for betting apps (37) and gambling help (43).
Its low handle of $954.69 and revenue per capita ($102.94) numbers also play a part in its low ranking, showing limited betting traction among residents. Low financial risk, exhibited by a low credit card delinquency rate of 3.97%, reinforces its bottom position.
24. Missouri
Missouri comes in second-to-last on the list, due to its minimal sports betting activity.
Despite hosting one of the largest football bases in the country, the Kansas City Chiefs, Missouri reports the lowest betting activity ($150.45 in handle per capita and $25.61 in revenue per capita) across all 26 states.
However, the main culprit here may be its limited access. The state has no online betting apps, even though sports betting is legal, and residents show extremely low interest in online betting, as evidenced by their search activity.
23. Oregon
Oregon is the next lowest state on the list for sports betting activity. Like other low-ranked states, Oregon shows weak betting activity and access. The state reports a single sports betting app, which has been accessible for the last 6 years, suggesting little growth in the industry over the time span.
Search interest is also low among residents, not breaking the score of 30 for either “sports betting” or “betting apps.” Combined with low financial betting numbers, including $878.00 in handle per capita and $96.29 in revenue per capita, these factors make Oregon a weaker environment for sports betting activity.
Sandberg adds, “I’m not surprised that sports betting has caught on so dramatically, especially with young Americans. It combines so many attractive elements, such as ease, risk, athletics, and thrills. But it can get dark fast, causing panic, depression, huge losses, and debt.”
“If you want to try your hand at sports betting, remember to only play the amount you can afford to lose and then walk away. If you can’t do that, don’t participate.”
In Summary
Sports betting has grown immensely in popularity in the U.S. over the last few years, as our results show. While gambling has had a place in our economy for decades, sports betting has seen a resurgence, moving into most professional sports, not just traditional horse racing.
Yet sports betting isn’t homogeneous across the nation. The results from our study reveal significant variation in the money wagered, consumer demand, and access from state to state. While some states, including New Jersey and West Virginia, have long-established markets, others are quickly growing their markets through increased interest and access despite lower betting volume.
The states with the most intense betting activity prioritize sports betting by meeting high engagement with strong market access, distinguishing them from the bottom tier of states.
Methodology
The methodology below explains the data inputs, scoring approach, and weighted metric framework used for this ranking.
Overview
This study, titled ‘States with the Most Intense Sports Betting Activity,’ aims to assess the propensity for sports betting across various states in the United States. While sports betting is legal in 39 states, this analysis includes only states with sufficiently developed markets and consistent public reporting across key metrics, resulting in a subset of 26 states.
By analyzing metrics related to betting behavior, financial harm, demand and distress, and access to betting resources, the study provides a comprehensive view of sports betting activity and related risk signals. The methodology is grounded in quantitative data sourced from reputable reports and databases, ensuring a robust analysis of the factors contributing to sports betting engagement and potential risk patterns across states.
Data & Sources
Data for this study were primarily sourced from established resources such as Legal Sports Report, Google Trends, the U.S. Census Bureau, and the Debt in America Report 2025, Urban Data Catalog. The study focuses on 26 ranked states, excluding 24 due to missing data, thereby ensuring that the analysis is based on complete and reliable information. The metrics selected reflect both the prevalence of sports betting activities and the associated societal impacts, allowing for a nuanced understanding of betting intensity levels across states.
Scoring Approach
The scoring for each state is based on a weighted system that allocates points across four key sections: Betting Behavior, Financial Harm, Demand & Distress, and Access. Each section comprises specific metrics, which are scored on a raw scale where higher values indicate greater issues related to sports betting intensity.
The cumulative score from all sections determines the overall ranking of each state, allowing for a clear comparison of betting intensity and risk-related indicators across the states analyzed. Per capita figures represent total betting activity relative to population and should be interpreted as a measure of market intensity, not individual behavior.
Caveats
It is important to note that the study relies on available data, and any states with missing data were excluded from the analysis, with the exception of Nevada. Given its longstanding history of gambling, Nevada was excluded from the rankings due to its expected position at the top of the list. This exclusion may lead to potential biases in the overall representation of sports betting intensity across the country.
Additionally, the metrics used primarily reflect online and mobile betting trends, which may not capture the full scope of sports betting behaviors in states with less digital engagement. Figures in certain states, such as New Jersey, may be influenced by tourism and out-of-state betting activity.
States Evaluated: 26
Sources Used: 4
Missing Data Rule: exclude
Scoring Process: Each selected metric is pulled for all eligible states and transformed to a standardized 0-100 scale. Directionality is applied per metric (higher-is-better or lower-is-better).
Optional divide-by metrics are computed as ratio values before normalization. Section scores are calculated as weighted averages of their component metrics. Final scores are computed as weighted averages of section scores using section point allocations.
Data Sources: Legal Sports Report, Google Trends, U.S. Census Bureau, Debt in America Report 2025, Urban Data Catalog
Section and Metric Weights
The study examines each state across four key metrics: betting behavior, financial harm, demand and distress, and market access.
Betting Behavior (45 pts · 2 metrics)
The Betting Behavior section evaluates the extent of sports betting activities within each state, focusing on metrics such as Total Handle and Total Revenue. These metrics provide insight into the volume of money wagered and the revenue generated from sports betting, which are critical indicators of betting engagement. By analyzing these figures, we can gauge the level of participation in sports betting and its economic impact on the state.
Total Handle / Total Population
Total Handle measures the total amount of money wagered on sports betting in a state. This metric is crucial because it reflects the overall engagement and popularity of sports betting among residents. A higher Total Handle indicates a greater level of betting activity, which directly correlates with potential betting intensity issues. The scoring for this metric is based on raw values, where higher amounts yield better scores, thus emphasizing states with more significant betting behaviors.
Total Revenue / Total Population
Total Revenue measures the overall financial intake from legal sports betting within a state, normalized by the total population. This metric is crucial for understanding the economic impact of sports betting on a state’s economy and its residents. A higher total revenue indicates a more robust sports betting market, which can correlate with increased social engagement and potential betting intensity issues. The ratio of revenue to population allows for a fair comparison across states with varying population sizes, highlighting states where sports betting is particularly lucrative relative to their population.
Financial Harm (15 pts · 1 metric)
The Financial Harm section assesses the negative financial impacts associated with sports betting, specifically through the Credit Card Delinquency Rate. This metric serves as an indicator of the financial distress that may be associated with broader risk behaviors, including gambling. By analyzing the delinquency rates, we can better understand the broader societal implications of sports betting, particularly how it affects personal finances and credit health.
Credit Card Delinquency Rate (All States)
The Credit Card Delinquency Rate measures the percentage of credit card accounts that are past due within a state. This metric is included as a general indicator of financial stress and is relevant in understanding broader risk environments that may overlap with gambling behavior. A higher delinquency rate suggests that more individuals are facing financial difficulties. However, this metric is not specific to sports betting activity and should be interpreted as a contextual measure rather than a direct indicator of betting-related harm. In this study, this metric is scored on a raw scale, where higher rates indicate greater financial stress, contributing to the overall ranking of the state.
Demand & Distress (15 pts · 4 metrics)
The Demand & Distress section evaluates public interest in sports betting and related topics through search interest metrics. By examining average search interest in terms such as ‘sports betting,’ ‘betting apps,’ ‘gambling betting intensity,’ and ‘gambling help,’ we can gauge the level of concern and engagement among the public. This section provides insight into the societal awareness and demand for resources related to gambling betting intensity, providing insight into public engagement and interest in betting-related topics.
Avg Search Interest “Sports Betting”
Avg Search Interest ‘Sports Betting’ reflects the frequency of online searches for sports betting over the past year, indicating public interest and engagement with this activity. This metric is significant as it can signal trends in gambling behavior and potential increases in participation and interest. Higher search interest may suggest a growing normalization of sports betting, which could lead to increased participation and associated social issues. Since this metric is raw, it directly reflects public curiosity without the need for population adjustments, making it a straightforward indicator of demand.
Avg. Search Interest “Betting Apps”
Avg. Search Interest ‘betting apps’ measures how often users search for mobile applications related to betting, providing insight into the technological shift in gambling behavior. This metric is particularly relevant as it highlights the convenience and accessibility of betting through apps, which can lead to increased gambling activity and potential betting intensity. A higher search interest indicates a growing trend towards mobile betting, which may reflect increased accessibility and engagement with betting platforms. As a raw metric, it serves as a direct measure of consumer interest without the need for population normalization.
Avg. Search Interest “Gambling Addiction”
Avg. Search Interest ‘gambling addiction’ tracks the frequency of searches related to gambling betting intensity, serving as an indicator of public concern and awareness regarding the negative consequences of gambling. This metric is vital for understanding the societal impact of sports betting, especially in states with high engagement in gambling activities. An increase in search interest may reflect rising awareness or personal struggles with gambling or betting intensity, signaling a need for intervention and support services. As a raw metric, it provides an unfiltered view of public sentiment and concern without adjustments for population size.
Avg. Search Interest “Gambling Help”
Avg Search Interest ‘gambling help’ tracks the frequency of searches for resources related to gambling assistance. This metric is important because it indicates the level of distress experienced by individuals seeking help for gambling problems. A higher interest in gambling help suggests that more individuals are recognizing their need for support, which may indicate increased demand for support resources. This metric is scored on a raw scale, where greater search interest leads to improved scores, impacting the state’s overall ranking.
Access (25 pts · 3 metrics)
Access measures how easy it is for residents to participate in sports betting, based on the availability of mobile betting, the number of operators, and how long betting has been legal in the state. States with more apps, legal online betting, and longer-established markets score higher, reflecting greater exposure and ease of use.
Total Betting Apps per State
The Total Betting Apps metric measures the number of licensed mobile sportsbooks available within a state. This serves as an indicator of market competition and consumer choice, both of which influence how easily residents can engage with sports betting. A higher number of available apps typically reflects a more developed and competitive market, increasing accessibility and convenience for users. As a raw metric, higher values contribute to a higher score, reflecting greater exposure to sports betting opportunities.
Legal Betting Online
The Legal Betting Online metric captures whether residents can place bets through mobile or online platforms within a state. This is a critical factor in accessibility, as online betting significantly reduces friction compared to in-person wagering. States where online betting is legal tend to see higher levels of participation due to the ease and immediacy of access. This binary metric (legal vs. not legal) is scored to reflect the presence of mobile betting infrastructure as a key driver of engagement.
Total Years Legal per State
The Total Years Legal metric measures how long sports betting has been permitted within a state. This reflects market maturity and the degree to which betting has become established over time. Longer-standing markets tend to have more developed ecosystems and sustained user engagement. To ensure comparability across states, this metric is capped to limit the influence of legacy markets and is scored such that more years of legalization contribute to a higher score.
Notes: Values are normalized comparatively within this specific study configuration and state set. Changing metrics, weights, section points, filters, tags, or divide-by choices changes the final rankings.


